Bitcoin Falls Below Rainbow Chart Floor Into 'BTC Is Dead' Zone

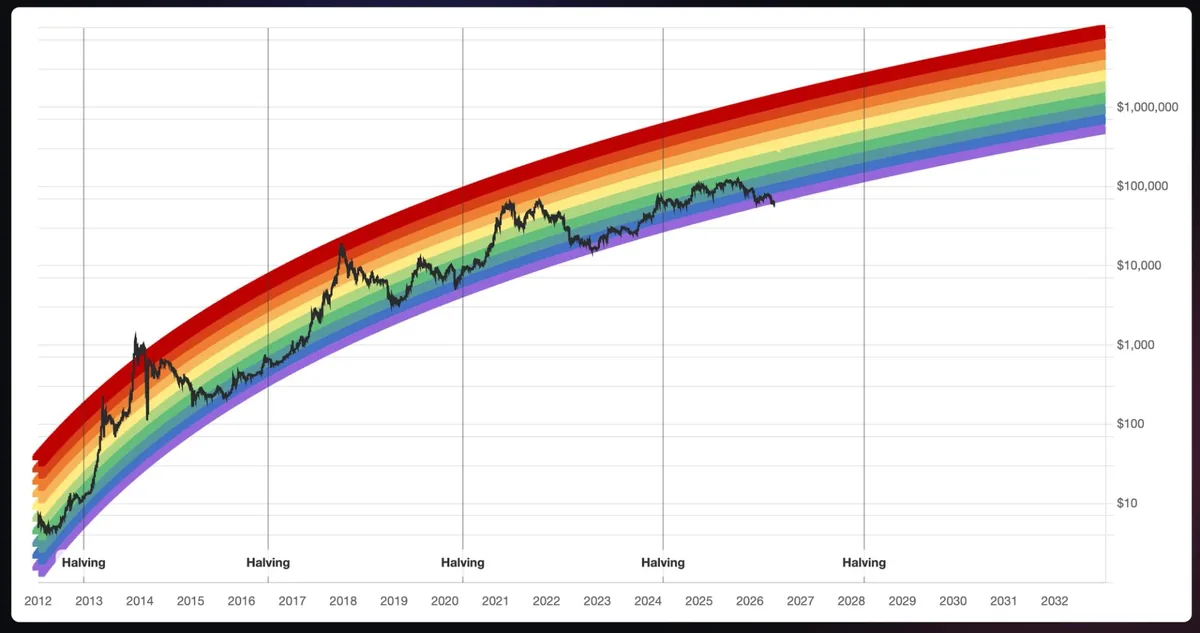
Bitcoin has moved below the lower boundary of the well-known Bitcoin Rainbow Chart, entering the area labeled the 'BTC is dead' zone. The move is notable because the chart is widely watched as a sentiment and valuation reference point, though it should not be treated as investment advice.

Bitcoin Falls Below Rainbow Chart Floor Into 'BTC Is Dead' Zone

What happened?

Bitcoin has moved below the lower boundary of the well-known Bitcoin Rainbow Chart, entering the area labeled the 'BTC is dead' zone. The move is notable because the chart is widely watched as a sentiment and valuation reference point, though it should not be treated as investment advice.

Why it matters

Bitcoin has broken below the floor of its famous Rainbow Chart and entered the section labeled the 'BTC is dead' zone, according to CoinDesk. The move places BTC outside the lower band of a popular long-term market visualization followed by some crypto traders and observers.

Bitcoin has broken below the floor of its famous Rainbow Chart and entered the section labeled the 'BTC is dead' zone, according to CoinDesk. The move places BTC outside the lower band of a popular long-term market visualization followed by some crypto traders and observers.

The development matters because the Rainbow Chart is commonly used as a simplified way to frame Bitcoin's price against historical market sentiment. A break below its lower boundary can draw attention from readers watching whether market confidence is weakening or whether the chart's framing is being challenged by current conditions.

The chart's label, 'BTC is dead,' is a dramatic shorthand rather than a literal conclusion about Bitcoin's status. It reflects an extreme zone on the model, not a verified statement that Bitcoin or its network has failed.

For the broader crypto market, the breach is mainly a sentiment signal. It may influence discussion among traders, analysts, and crypto-native companies that monitor Bitcoin as the sector's benchmark asset, but the source does not establish a direct causal effect from the chart move to market behavior.

As with any single market indicator, the Rainbow Chart offers context rather than certainty. Readers should treat the move as one data point in the wider Bitcoin market narrative, not as a standalone basis for financial decisions.

Source: CoinDesk

Keep exploring

Related stories

Bitget to Leave Japan and Close Remaining Positions by Year-End

Bitget to Leave Japan and Close Remaining Positions by Year-End

Bitget plans to exit the Japanese market and close all remaining positions by the end of the year. The move adds to ongoing shifts among crypto companies navigating Japan’s regulatory environment.

Read
State of Crypto countdown highlights key industry developments

State of Crypto countdown highlights key industry developments

CoinDesk’s State of Crypto coverage counts down recent developments shaping the crypto policy and market landscape. The report frames these changes as important for how companies and participants navigate the sector.

Read
Strategy Keeps STRC Dividend at 12%

Strategy Keeps STRC Dividend at 12%

Strategy said it is holding the dividend on its STRC preferred stock at 12%. The decision keeps the payout unchanged for investors in the company’s yield-focused security.

Read